03 Feb February’s Free MBTN Tutorial – Descriptive Statistics 1
Statistics play a pivotal role in data analytics for helping us uncover patterns and relationships within datasets. Whether you’re deciphering trends in finance, exploring healthcare outcomes, or investigating alternative social media marketing options, a solid grasp of statistical measures is crucial for drawing meaningful conclusions. In this month’s free tutorial, we’ll explore some commonly used statistics that help describe and summarize datasets, shedding light on both the center and variability of the data.
This is the first and most basic module in our statistics series. In this tutorial we’ll get you started with the most basic ways to describe a dataset including measures of central tendency and measures of variability.
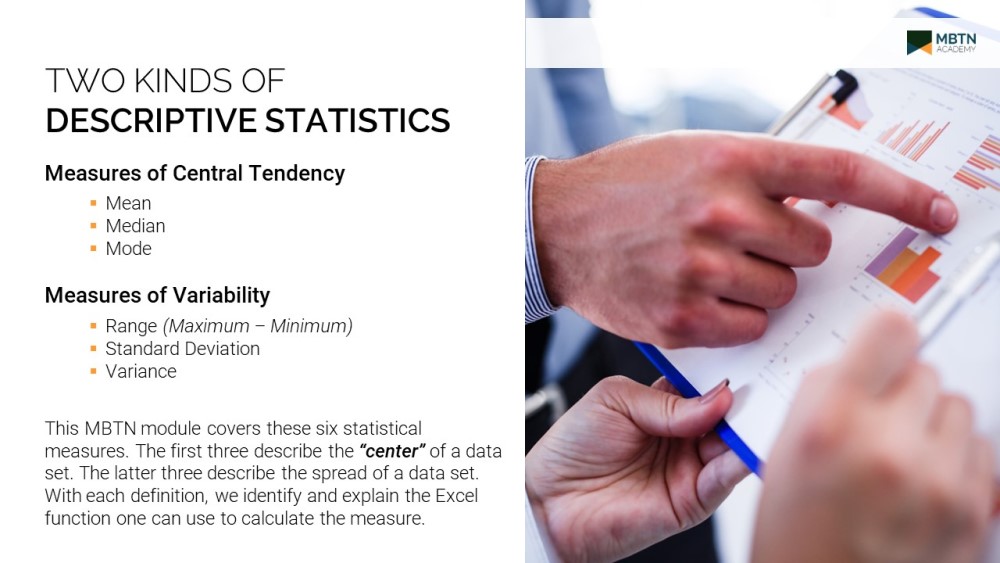
Measures of Central Tendency:
- Mean: The mean, or average, is perhaps the most familiar statistic. It’s calculated by summing all values in a dataset and dividing by the number of observations. While the mean provides a sense of the dataset’s center, it can be sensitive to outliers, making it important to consider the entire distribution.
- Median: Unlike the mean, the median represents the middle value when the dataset is ordered. This measure is less influenced by extreme values, making it a robust indicator of central tendency. It’s especially useful in scenarios where outliers may distort the mean.
- Mode: The mode identifies the most frequently occurring value in a dataset. While not always applicable, it can be particularly useful for categorical data or datasets with clear peaks.
Measures of Variability:
- Range: The range is the simplest measure of variability, calculated by subtracting the minimum value from the maximum value. While easy to compute, it’s sensitive to outliers and may not provide a comprehensive understanding of the data’s spread.
- Standard Deviation: The standard deviation quantifies the amount of variation or dispersion in a dataset. A smaller standard deviation indicates that the values are closer to the mean, while a larger standard deviation suggests greater variability. It is a valuable tool for assessing the overall consistency within the dataset.
- Variance: Variance is the square of the standard deviation and provides a measure of the average squared deviation from the mean. It is particularly useful in statistical modeling and analysis, but its units are squared, making interpretation less intuitive.
It is essential to fully understand these basic measures before moving on to more advanced topics such as regression and time series. Faculty will often use the Statistics 1 module as a review for graduate students or as a core element of business classes that work with datasets.
The free link has expired, but check out this month’s tutorial under the Business Education Resources Blog.
If you find these tutorials valuable and you are faculty at a University or Community College, you might also be interested in our complete catalog of MBTN modules, available for use in academic settings. You can choose any combination of 3 or more modules to suit your needs.
Our complete catalog of MBTN modules
If you are an individual interested in learning more about Business metrics and key business concepts, please consider access to our 60+ learning modules.
MBTN All Modules and Certifications ($99.95)
Best regards,
Your Team at MBTN Academy
Follow us on Twitter, Mastodon, and LinkedIn


Sorry, the comment form is closed at this time.